
Sur cette page
HalfTrend is one of those indicators everyone recognises from TradingView screenshots — the stepped line that sits flat under price for weeks, then snaps to the other side — and almost nobody can explain. Here's the mechanic, and then, because explanations are cheap, a measurement of what it actually does across 50 coins of real history.
The latch, in plain language
Most trend indicators re-evaluate every bar. HalfTrend *latches*. While it's in an uptrend it only tracks one thing: the highest low of the last amplitude bars (default 2), ratcheting its trail upward and ignoring everything else. To flip it demands two things at once: the short moving average of lows must clear the ratchet from the other side, *and* price must close beyond the previous bar's extreme. Until both happen, the trend state simply refuses to change — and on the bar it finally flips, the new trail starts exactly where the old one ended, which is why the line looks like a staircase instead of a wiggle.
That refusal is the entire product. The question is what it's worth.
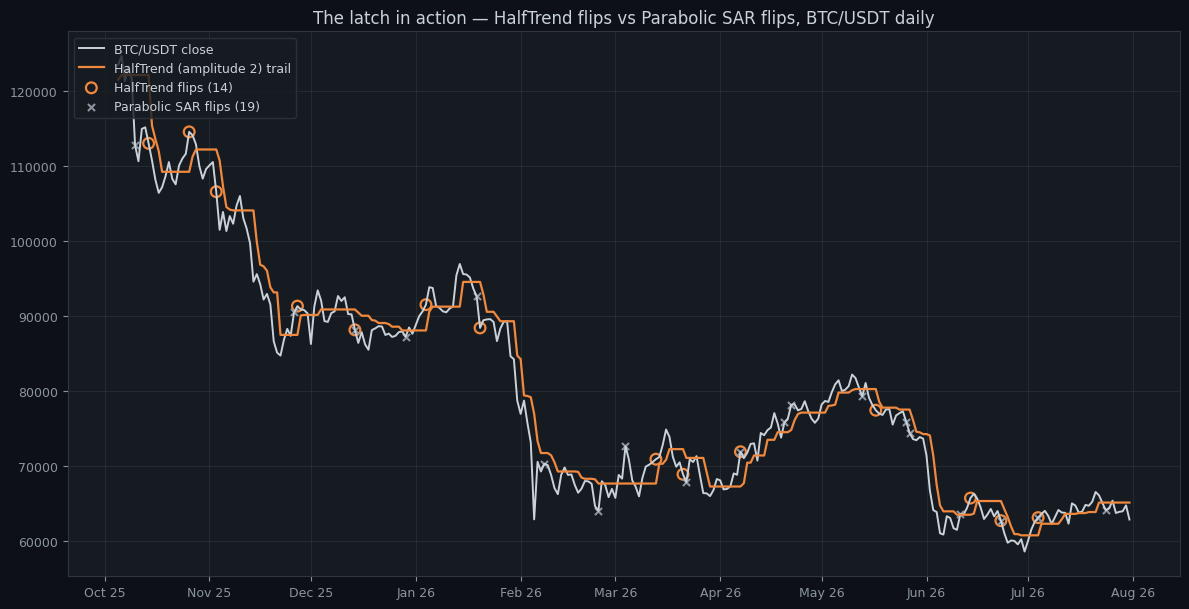
Measured against its rivals
Same protocol as our SAR vs SuperTrend scoreboard: 50 coins, daily bars 2021-01-01 → 2026-07-31, defaults, long when the indicator says up and flat otherwise, 0.1% per position change, final 30% of history held out as the honest window.
- **Flip frequency (median): HalfTrend 17.2 per year — between Parabolic SAR's 29.1 and SuperTrend's 7.8.** The latch halves SAR's churn; it does not reach SuperTrend's calm, because a two-bar amplitude still reacts to small structures.
- **In-sample, all three are clones: median Sharpe +0.73 vs +0.72 vs +0.72.**
- **Out-of-sample, all three are negative: HalfTrend −0.66, SAR −0.66, SuperTrend −0.41.** Nine of 50 coins kept a positive out-of-sample Sharpe under HalfTrend. Daily trend-flipping as a standalone system has simply had a bad two years, and no amount of latch changes that.
- **Head-to-head on full-period return, HalfTrend edges SAR 26–24 — a coin flip — and loses to SuperTrend 21–29.**
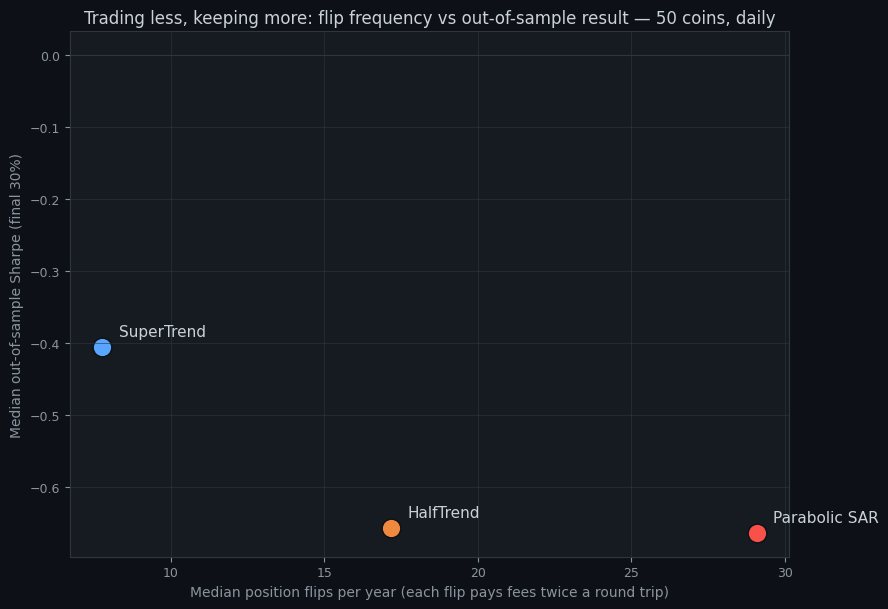
So what is it good for?
The honest reading of the table: the latch is real — it cuts churn roughly in half versus SAR at identical in-sample quality — but as an *entry signal* none of the three earned their fees on the unseen window. Where a latched flipper shines is as a regime gate and an alert: a line that changes state 17 times a year instead of 29 is a far better "the character of this market changed" bell than a hair-trigger one. That's exactly how it's wired into our engine — the flip is alertable (state crosses 0), and the trail is a usable stop reference.
The assumptions behind every number above are documented on the methodology page, and the whole experiment is one free backtest away from being yours to break.
Essaie-le sur tes propres données
Chaque concept ci-dessus est implémenté dans la plateforme. Backtest, walk-forward, paper trading, puis passage en live — même jeu de règles à chaque étape.