
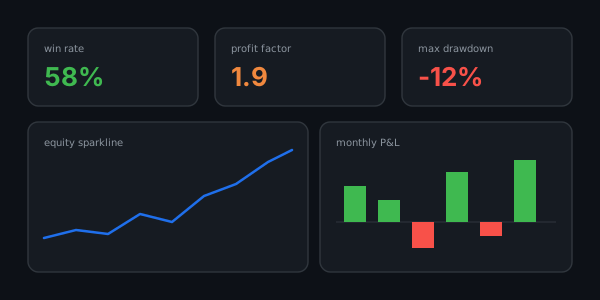
Every run lands in Run History with a panel of analytics. The headline return is the least useful number on it. The honest read combines four views, each answering a different question about whether you could actually live with this strategy.
The equity curve — shape
The Equity curve plots account Equity over the run. Read its shape, not just its endpoint: a steady upward slope is worth far more than the same return delivered in two violent spikes around long flat stretches. A curve that climbs only in one market regime is telling you the strategy works in one regime.
Drawdown — pain
The Drawdown is the peak-to-trough decline in equity. It is the number that decides whether you can actually stick with the strategy when it is losing. A backtest with a 60% max drawdown will be abandoned by a real human at the bottom — which means its lovely final return is fiction for you specifically.
Sharpe — smoothness
The Sharpe ratio is return divided by the volatility of those returns. It rewards consistency: a strategy making 12% smoothly can out-score one making 20% in lurches. Watch how Sharpe behaves across walk-forward windows — a Sharpe that is high in-sample and collapses out-of-sample is the signature of Overfitting.
The trade ledger — truth
The Trade ledger is the row-by-row record behind every aggregate: each trade's entry, exit, direction, size, fees, and P&L. When a metric surprises you, this is where you go. Three trades carrying the entire return? A win rate built on one outlier? The aggregates hide it; the ledger shows it. Judge a strategy on the distribution of trades, never on three of them.
If expectancy, win rate, and average R as aggregate metrics are unfamiliar, the Trading 101 strategy lesson defines them before you start reading them off a panel.
Reflection
Pick a past run and find its single best trade in the ledger. Remove it mentally — does the strategy still have an edge, or was that one trade carrying everything?
Further reading
Deeper dives on this topic from our blog (English).
- How to read an equity curve like a fund managerHow to read an equity curve: drawdowns, MAR, ulcer index, smoothness, regime-by-regime breakdown. Practical checks before deploying a backtest.
- Sharpe vs Sortino vs Calmar: which risk-adjusted ratio to trustSharpe vs Sortino vs Calmar compared: what each risk-adjusted return metric measures, where each misleads, and which to use to evaluate a trading strategy.
- Max drawdown: the backtest number that predicts whether you'll quitMax drawdown explained: what it measures, why drawdown duration matters as much as depth, how to size around it, and why backtests understate it.