Sur cette page
Most indicators try to tell you *when* to trade. ATR — Average True Range — tells you *how much the market is moving*, and that turns out to be the more useful question for the parts of a strategy that actually control risk. You don't backtest ATR as an entry signal; you backtest it as the engine behind your stops and your position size. This walkthrough shows how to do that without fooling yourself.
Step 1: use ATR for what it's for
ATR measures the average size of a candle's range over a lookback, including overnight gaps. A high ATR means big swings; a low ATR means a quiet market. On its own that is not a buy or sell signal — and "buy when ATR is high" backtests like noise, because volatility has no inherent direction. ATR earns its keep in two places: setting a stop-loss a sensible distance from price, and sizing the position so each trade risks the same amount of money regardless of how volatile the market is.
A fixed-percentage stop ignores the market's state — a 2% stop is miles away in a quiet market and gets clipped instantly in a volatile one. An ATR-based stop adapts: place it, say, 3 ATR below entry and it sits proportionally wide when the market is wild and tight when it's calm.
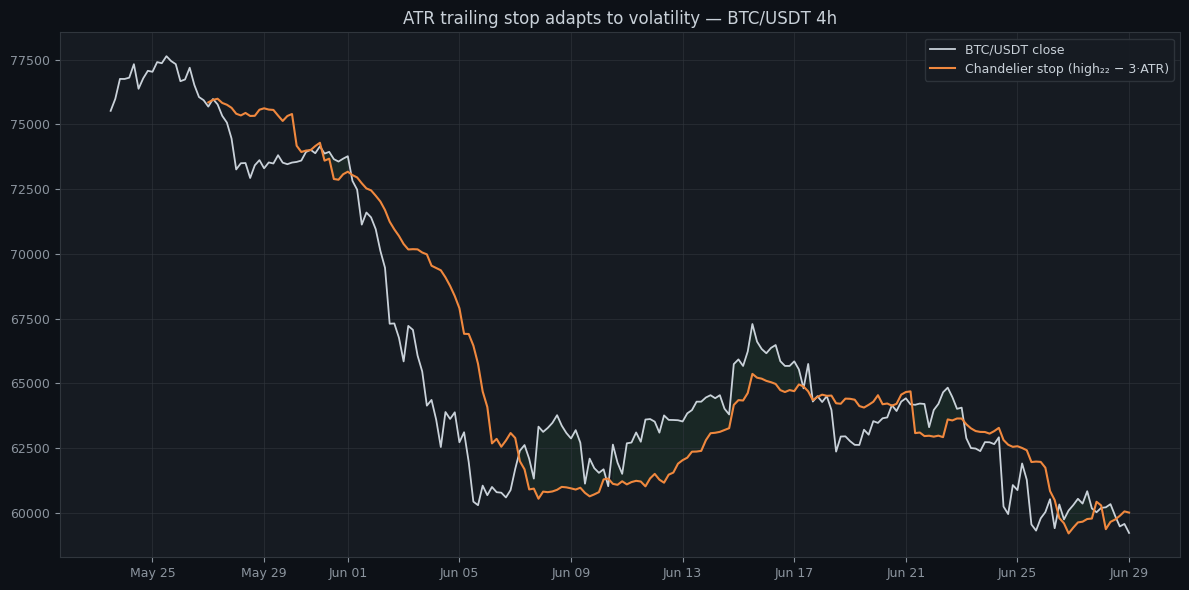
The chart shows a chandelier stop — the recent high minus 3× ATR. Notice how the distance between price and the stop breathes with volatility: it gaps wide through the sharp moves and pulls in tight through the quiet drift. That is exactly the adaptiveness a fixed stop can't give you.
Step 2: get clean, multi-regime data
Fetch real OHLCV candles for the symbol, timeframe, and exchange you'll trade, over a window with more than one regime — trends and chop, a rally and a sell-off. ATR-based exits behave very differently across regimes, so a single calm stretch will mislead you.
Step 3: run it and read risk-aware metrics
Because ATR's whole job is risk control, judge it on risk-aware numbers, not raw return. Watch maximum drawdown (did the adaptive stop actually cap the pain?), the Sharpe ratio, and the distribution of individual trade losses — a good ATR stop should make your worst losses *consistent* in risk terms, not wildly uneven.
Here is a complete, testable rule: a simple trend entry, with ATR doing the risk work via a volatility stop and ATR-scaled sizing.
strategy:
  name: atr_trend_risk
  indicators:
    - { id: ema_fast, kind: EMA, period: 20 }
    - { id: ema_slow, kind: EMA, period: 50 }
    - { id: atr, kind: ATR, period: 14 }
  rules:
    entry:
      all:
        - { type: crosses_above, left: ema_fast, right: ema_slow }
    exit:
      any:
        - { type: crosses_below, left: ema_fast, right: ema_slow }
  risk:
    stop_loss_atr: 3.0      # stop 3×ATR from entry — adapts to volatility
    size_mode: atr_risk     # size so each trade risks the same % of equity
    risk_pct: 0.5
Step 4: walk-forward the multiplier
The ATR multiplier (here, 3.0) is a parameter — and parameters are where overfitting hides. It is trivially easy to grid-search the multiplier on your whole history and find the value that would have dodged every drawdown. That number is a memory of the past, not a rule for the future. Walk-forward settles it: tune the multiplier on an early window, test it on the next, unseen window, and roll forward. A multiplier that only works because it was hand-picked on the full history will fall apart out-of-sample; one that holds is a real risk setting you can trust.
Do it in Noon Barbari
ATR is in the indicator library, and stops and sizing are first-class risk controls in the strategy designer — you set an ATR stop and ATR-scaled sizing without code, then backtest over years of data in seconds. Run walk-forward on the multiplier to confirm it's a real setting rather than a curve-fit. ATR won't tell you when to enter — but it will make every trade you do take risk the same disciplined amount.
Essaie-le sur tes propres données
Chaque concept ci-dessus est implémenté dans la plateforme. Backtest, walk-forward, paper trading, puis passage en live — même jeu de règles à chaque étape.