
Sur cette page
Bollinger Bands are three lines: a moving average in the middle and a band above and below it. The retail reading — sell at the upper band, buy at the lower — is wrong often enough to drain an account. The bands do not mark expensive and cheap. They mark volatility. Get that straight and the indicator changes from a contrarian trap into a genuine tool.
How the bands are built
The middle line is a simple moving average, usually 20 periods. The outer bands sit a number of standard deviations away — typically two — measured over the same window. Standard deviation is a volatility measure, so the bands widen when the market gets volatile and contract when it goes quiet. The band width is the signal; the band touch usually is not.
Statistically, with 2-standard-deviation bands, roughly 95% of recent prices fall inside them — but only if returns were normally distributed, which crypto returns emphatically are not. Crypto has fat tails: price rides the band and pierces it far more often than the textbook says. That alone kills the naive 'reversion at the band' rule.
The squeeze — the setup that holds up
The most robust Bollinger pattern is the squeeze: the bands contract to an unusually narrow width, signalling that volatility has collapsed. Volatility is mean-reverting — quiet periods are followed by active ones — so a tight squeeze is a reliable tell that a larger move is coming. What it does not tell you is direction. The squeeze is a 'something is about to happen' signal; you need a separate trigger (a breakout, a trend filter) to decide which way to trade it.
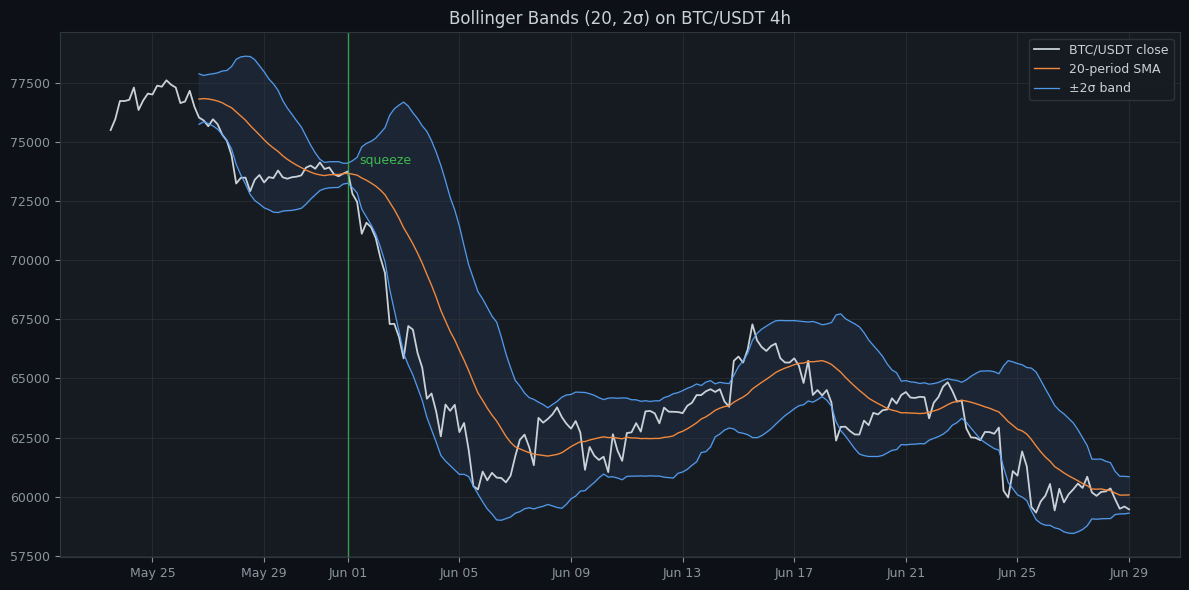
The chart above is a live example on BTC/USDT 4-hour candles. Notice what the squeeze did and did not do: days in advance it flagged that volatility had collapsed and a move was loading — and then price expanded hard. It said nothing about *which way*. A trader who bought the "bounce" off the lower band as the squeeze broke would have been run over. That is the whole lesson of the indicator in one picture: the bands time volatility, not direction.
The bounce — only with a regime filter
The mean-reversion 'bounce' off a band can work — but only when the market is ranging. In a trend, price walks the band and every counter-trend bounce trade is a loss. So the bounce is never a standalone rule. Gate it: only take band-touch reversion entries when a trend filter says the market is rangebound (flat long EMA, low ADX). Inside a range the bounce has an edge; outside one it is a slow bleed.
Choosing the period and width
The 20-period, 2-standard-deviation defaults are a reasonable starting point, not a law. A shorter lookback (10) makes the bands hug price and squeeze more often — more signals, more noise. A wider band (2.5–3σ) makes touches rarer and breakouts more meaningful. The trap is tuning these on one slice of history until the backtest sparkles: that is just overfitting the bands to the past. Pick sensible defaults, then confirm they hold up out-of-sample with walk-forward before you trust them.
Backtest both modes — separately
Squeeze-breakout and band-bounce are opposite strategies — one bets on expansion, one on reversion — and they win in opposite regimes. Backtesting them blended together produces a mush that hides which one is actually working. Test each on its own, with its regime filter, and you will see clearly: the breakout earns in trends, the bounce earns in ranges. Then, if you want, combine them with the regime filter as the switch.
Bollinger Bands are in Noon Barbari's built-in indicators, and a BB squeeze strategy is one of the reference templates. Build the squeeze and the bounce as two rule sets, backtest each separately, and let the numbers show you which regime each one needs.
Bollinger Bands answer one question well: how volatile is this market right now, relative to its recent self? Use them for that — the squeeze for timing, the band width for regime — and stop using a band touch as a price verdict it was never designed to give.
Essaie-le sur tes propres données
Chaque concept ci-dessus est implémenté dans la plateforme. Backtest, walk-forward, paper trading, puis passage en live — même jeu de règles à chaque étape.