
En esta página
Parabolic SAR and SuperTrend answer the same question — *which side of the trend are you on?* — with the same output: a trailing line that flips from one side of price to the other. So the argument about which is "better" should be settleable with data. We settled it the way we settle everything: same engine, same 50 coins, daily bars from 2021-01-01 through 2026-07-31, default parameters for both (SAR 0.02/0.02/0.2, SuperTrend 10/3), long when the indicator says up, flat when it says down, 0.1% fees on every position change. The first 70% of each coin's history is the in-sample window; the final 30% — roughly mid-2024 onward — is the part neither indicator got to flatter itself on.
The scoreboard
Across all 50 coins:
- **Head-to-head wins (full-period return): SuperTrend 34, Parabolic SAR 16.**
- **Median in-sample Sharpe: dead even — +0.72 vs +0.72.** On the window a backtest screenshot usually shows, you cannot tell these strategies apart.
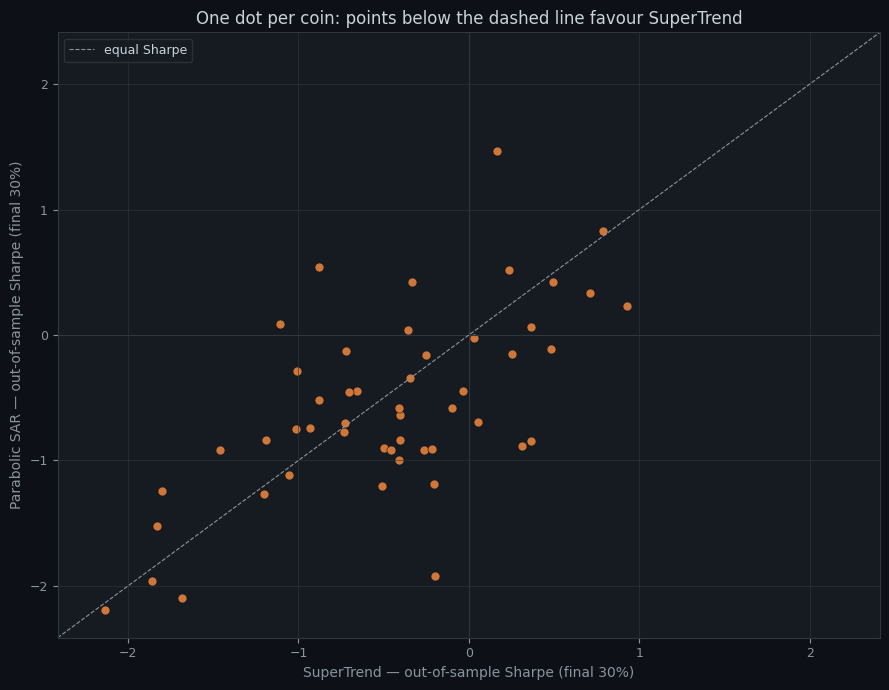
- **Median out-of-sample Sharpe: SuperTrend −0.41, Parabolic SAR −0.66.** Read that again: *both negative*. The last 30% of history was hostile to daily trend-flipping in general — SuperTrend just bled slower.
- **Out-of-sample survivors (positive Sharpe): SuperTrend 13 of 50, SAR 11 of 50.**
- **Median full-period return: SuperTrend +44.7% vs SAR −2.2%**, with deep drawdowns either way (−79% vs −85% median max drawdown — long-flat did not spare anyone the 2022 bear).
The real difference is churn
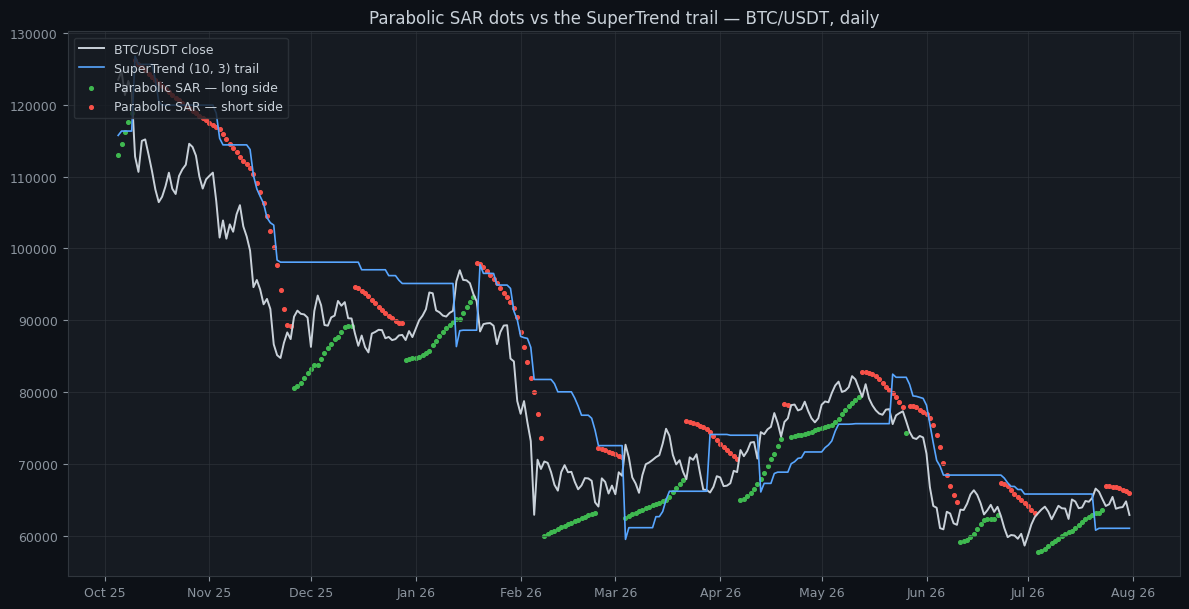
The number that explains the gap isn't a Sharpe ratio. It's this: the median coin flipped position 29 times per year under Parabolic SAR and 7.8 times per year under SuperTrend.
That's the design working as intended. SAR's acceleration factor exists to hug price harder the longer a trend runs — brilliant for trailing a stop out of a parabolic move, brutal on a choppy daily chart where every wobble tags the dots. SuperTrend's ATR-sized buffer ignores exactly the wobbles SAR trades. At 0.1% per side, 29 flips a year is roughly 3% of the account paid in fees annually before slippage — a headwind the signal has to out-earn before it counts a single point of edge.
On Bitcoin alone the pattern is the same: buy-and-hold returned +114% over the window, SuperTrend +11% with 9.5 flips a year, SAR −2% with 31. Neither flip system beat holding the strongest coin — which is why we test on the unseen window instead of admiring the fitted one.
What Parabolic SAR is actually for
Welles Wilder didn't design SAR as an entry signal — the acceleration mechanic is a *stop-and-reverse trail*. Used that way its churn is a feature: the stop tightens as the move matures, and the flip is your exit bell, not your entry trigger. If you take one thing from the scoreboard, take this: SAR belongs at the exit side of a rule set whose entries come from something slower.
Both indicators are now in our engine — the SAR implementation matches the TA-Lib reference to floating-point precision, and HalfTrend joined alongside it. Everything above is reproducible under the assumptions on our methodology page, and you can put any variant of either through the free backtester — no signup, robustness scorecard included.
Pruébalo con tus datos
Cada concepto de arriba está implementado en la plataforma. Backtest, walk-forward, paper trading, luego live — el mismo conjunto de reglas en cada etapa.