
On this page
Win rate is the statistic beginners obsess over and professionals barely glance at. "My strategy wins 75% of the time" sounds like a winning strategy. It is not a statement about profitability at all. On its own, win rate tells you nothing — and chasing a high one leads traders straight into the most dangerous strategy profiles there are.
Why win rate alone is meaningless
Win rate is the percentage of trades that close in profit. What it omits is the size of those wins and losses. A strategy can win 90% of its trades and still lose money if the occasional loss is large enough to wipe out a long string of small wins. A strategy can win 35% of its trades and be highly profitable if its wins dwarf its losses. Win rate measures how often you are right. Profitability depends on how much you make when right versus how much you lose when wrong — and those are completely separate numbers.
Risk-reward — the other half
The risk-reward ratio is the size of the average win divided by the size of the average loss. A ratio of 3 means winners are, on average, three times the size of losers. Risk-reward and win rate trade off against each other by the nature of a strategy: trend-following strategies tend to have low win rates and high risk-reward; mean-reversion strategies tend to have high win rates and low risk-reward. Neither pairing is better. What matters is how the two numbers combine.
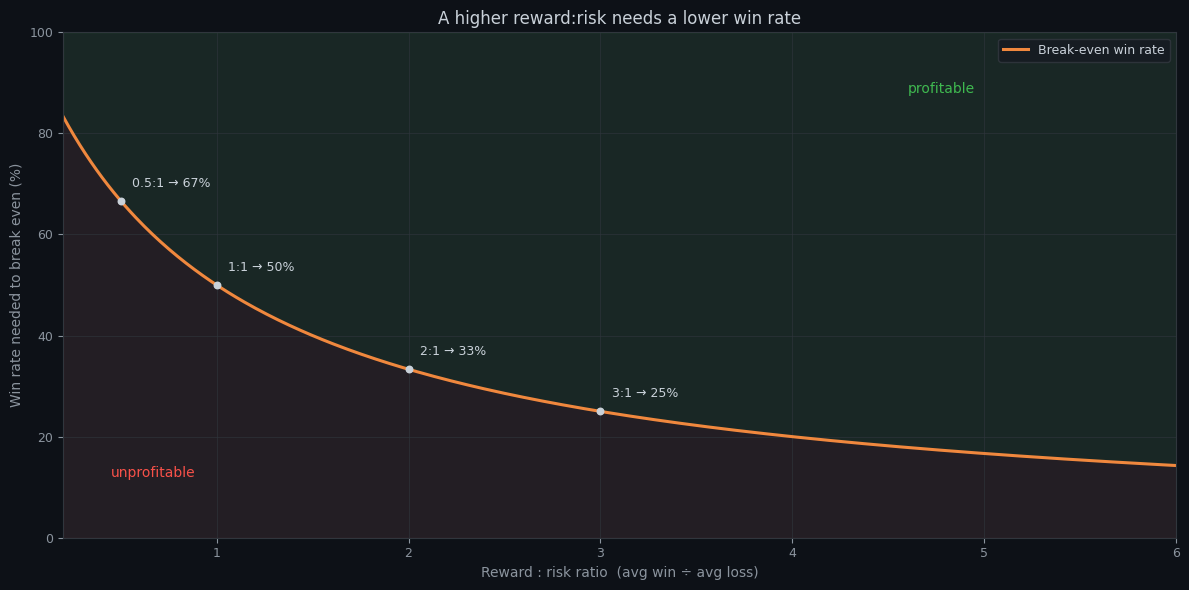
The curve above is just arithmetic, but it reframes the whole debate. To break even, your win rate only has to clear 1 ÷ (1 + reward:risk). At 1:1 you need 50%. At 2:1 you need only 33%; at 3:1, just 25%. That is why a trend follower who is wrong two times out of three can still compound steadily — the rare wins are large enough that a low hit rate clears the bar with room to spare. Anywhere above the curve is profitable; the win rate by itself tells you nothing about which side of it you are on. It also explains why forcing a higher win rate — by widening stops or snatching quick profits — usually backfires: you slide left along the curve into its steep edge, where the hit rate you suddenly need climbs faster than the one you actually gained.
Expectancy — the number that actually matters
The single statistic that tells you whether a strategy makes money is expectancy: the average profit or loss per trade, accounting for both inputs at once.
expectancy = (win_rate * avg_win) - (loss_rate * avg_loss)

# Example A — 90% win rate, but tiny wins and huge losses:
#   (0.90 * 1.0) - (0.10 * 12.0) = 0.90 - 1.20 = -0.30  -> LOSES money
#
# Example B — 35% win rate, but wins dwarf losses:
#   (0.35 * 4.0) - (0.65 * 1.0)  = 1.40 - 0.65 = +0.75  -> MAKES money

# Positive expectancy = a strategy worth trading. Win rate alone = noise.How to read these numbers
- Never evaluate win rate alone — it is half a sentence. Always read it next to risk-reward.
- Compute expectancy — if it is not positive after costs, the strategy does not work, whatever the win rate says.
- Match the profile to your psychology — a low win rate means long losing streaks you must hold through; a high one means rare losses you must keep small.
- Distrust extremes — a 95% win rate is a reason to inspect the stop-loss, not to celebrate.
Every Noon Barbari backtest reports win rate, average win and loss, and expectancy together — never win rate in isolation — so you judge a strategy on whether it makes money, not on how often it is right. The free tier includes the full trade-statistics breakdown.
Being right often and making money are different achievements. Win rate measures the first. Expectancy measures the second. Only one of them pays.
Try it on your own data
Every concept above is implemented in the platform. Backtest, walk-forward, paper-trade, then promote to live — same rule set, all stages.