
On this page
Our curve-fitting study answered one question at the aggregate level: across ten strategy families, roughly half of a tuned backtest's Sharpe was memory, not signal. This post answers the follow-up everyone asked — which families? Which designs actually kept an edge on data they had never seen, and which only ever looked good because we let them pick their own best settings?
The setup is identical to the parent study, so here it is in one paragraph. For each of ten strategy families we tuned a small, realistic parameter grid on the first 70% of each coin's daily history (Jan 2021 onward), picked the best-Sharpe configuration — the one a curve-fitter would ship — and ran that single winner once on the last 30%, which it never saw. Twenty liquid USDT pairs, 11,440 total engine runs, the same event-driven backtester that powers our free backtester, and the full dataset is public under CC BY 4.0. What changes here is the lens: instead of pooling everything, we rank each family by the *median* out-of-sample Sharpe of its tuned winner across all twenty coins.
The ranking
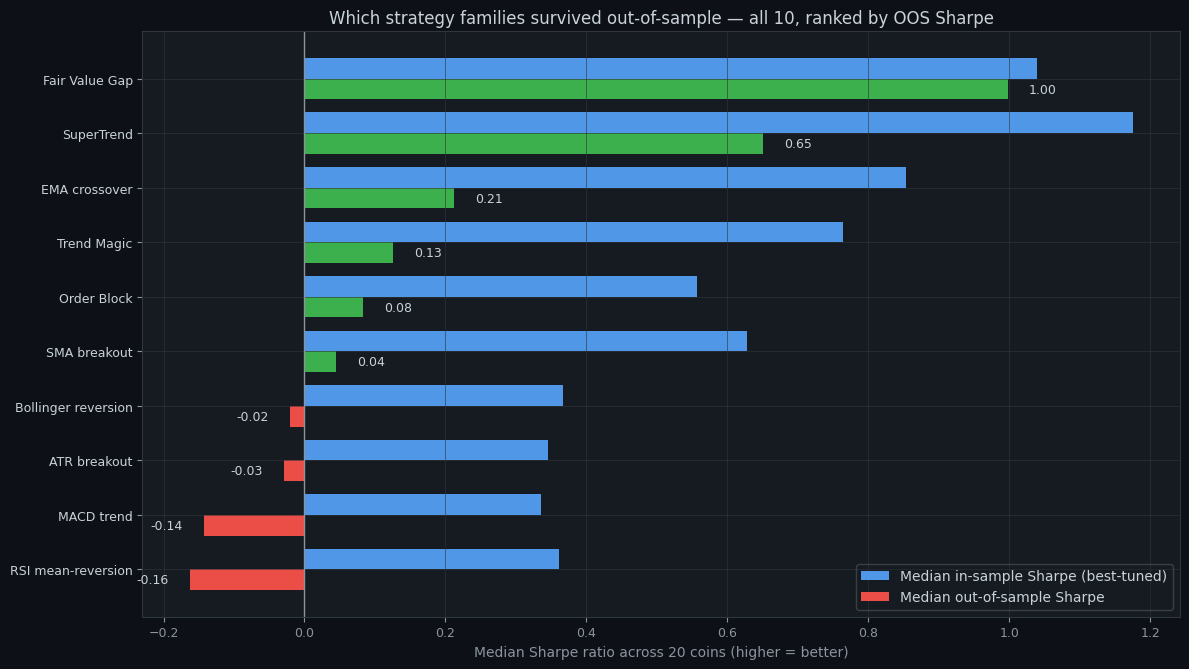
| Family | Median IS Sharpe | Median OOS Sharpe | Decay | Coins with OOS Sharpe > 0 | |---|---|---|---|---| | Fair Value Gap | 1.04 | 1.00 | 0.04 | 17 / 20 | | SuperTrend | 1.18 | 0.65 | 0.52 | 18 / 20 | | EMA crossover | 0.85 | 0.21 | 0.64 | 12 / 20 | | Trend Magic | 0.76 | 0.13 | 0.64 | 12 / 20 | | Order Block | 0.56 | 0.08 | 0.47 | 11 / 20 | | SMA breakout | 0.63 | 0.04 | 0.58 | 11 / 20 | | Bollinger reversion | 0.37 | −0.02 | 0.39 | 10 / 20 | | ATR breakout | 0.35 | −0.03 | 0.37 | 10 / 20 | | MACD trend | 0.34 | −0.14 | 0.48 | 6 / 20 | | RSI mean-reversion | 0.36 | −0.16 | 0.52 | 3 / 20 |
*Median across all 20 coins per family — the "typical" tuned winner, not the best cherry-pick. Decay is median in-sample minus median out-of-sample Sharpe.*
The two that survived
Fair Value Gap is the standout: a median out-of-sample Sharpe of 1.00 and almost no decay (0.04). It was the only family whose median tuned winner held essentially all of its in-sample edge, and it was positive on 17 of 20 coins. That doesn't make it a money printer — a Sharpe of 1.0 on daily bars is good, not miraculous, and the three coins where it failed still failed. But it is the one design here whose backtest you could take roughly at face value.
SuperTrend kept the highest *positive* rate — 18 of 20 coins stayed above zero out-of-sample — but paid a real curve-fitting tax: its median Sharpe fell from 1.18 to 0.65, so about half the tuned edge was noise. This matches what we found in the dedicated SuperTrend vs EMA data piece: SuperTrend genuinely trends-follows, but its backtest flatters it. Trade the 0.65, not the 1.18.
The faders
EMA crossover, Trend Magic, Order Block and SMA breakout all landed in positive-but-thin territory — median out-of-sample Sharpe between 0.04 and 0.21. These are the dangerous ones, because their in-sample numbers (0.56 to 0.85) look tradeable and their out-of-sample numbers are close enough to zero that a few lucky coins can carry the average. The tuned pick beats a coin flip, but not by enough to survive fees, slippage and a bad month. If you trade one of these, the robustness score matters more than the headline return.
The three that never really worked
Bollinger reversion, MACD trend and RSI mean-reversion produced a negative median out-of-sample Sharpe — and not one of them cleared our "attractive" bar (Sharpe ≥ 1.0 with ≥ 10 trades) on a *single* coin, even after tuning. RSI mean-reversion was positive on just 3 of 20 coins out-of-sample.
This is not a claim that RSI or MACD are useless indicators — they're components in plenty of robust systems, and a different timeframe or a confluence filter might change the verdict. It's a narrower, data-backed point: as standalone daily-bar mean-reversion and trend templates over this period, tuning them harder didn't rescue them. The knobs had no good setting to find.
How to use this
Two honest takeaways. First, design matters more than tuning: the gap between Fair Value Gap and RSI mean-reversion (1.00 vs −0.16 median OOS) dwarfs the gap between any family's best and worst *settings*. Pick a structurally sound design before you optimize a weak one. Second, your coin is not the median — every family had coins where it failed, so a family ranking is a starting prior, not a guarantee. The only way to know your strategy on your market is to hold out data and test it once.
That is exactly what our free backtester does in about a minute, and what the monthly Crypto Overfitting Index tracks across the whole library. Compare any two of these families side by side on our strategy comparison pages, read the deeper mechanics in the strategy library, or download the raw runs from the open data page and rank them yourself.
Past performance does not guarantee future results. This is educational content, not financial advice.
Try it on your own data
Every concept above is implemented in the platform. Backtest, walk-forward, paper-trade, then promote to live — same rule set, all stages.