
Auf dieser Seite
Here is the move at the heart of almost every strategy that ever blew up: you sweep a parameter grid, sort by backtested Sharpe, and ship the winner. That whole workflow rests on one unstated assumption — that the *ranking* of your settings on past data resembles their ranking on the future. If the best in-sample configuration is also roughly the best going forward, tuning is science. If the ranking scrambles the moment you leave the sample, tuning is theater.
So we measured the assumption directly. Using the same 11,440-backtest study — ten strategy families, twenty coins, a clean 70/30 chronological split, all public under CC BY 4.0 — we did something simple for each of the 200 strategy-coin grids: rank every parameter combination by in-sample Sharpe, rank them again by out-of-sample Sharpe, and measure the correlation between the two rankings. A correlation of 1.0 means the in-sample order was perfectly predictive; 0 means your optimizer's favorite was, on average, no better than picking a setting blindfolded.
The answer: 0.37, and wildly unstable
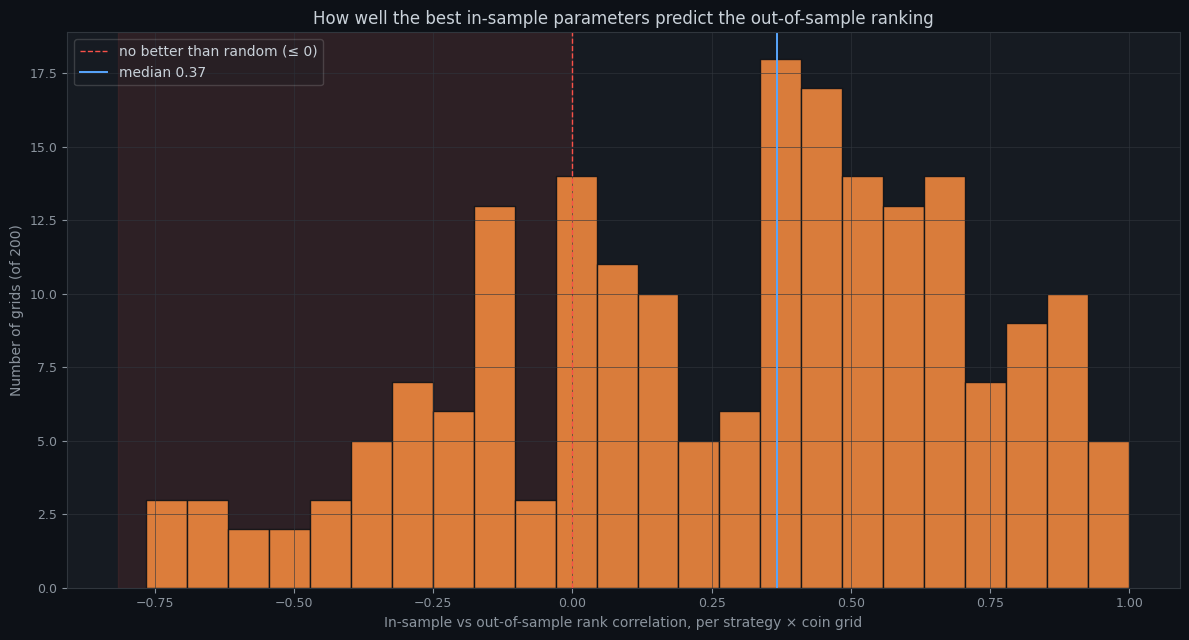
The median rank correlation was 0.37 — positive, but weak. And the spread is the real story:
- **26% of grids had a correlation of zero or below.** In a quarter of cases the in-sample winner was no better than a coin flip at predicting the out-of-sample winner — and sometimes actively worse. The worst grid came in at −0.77: its best-backtesting settings were close to its *worst* going forward.
- **19% landed between 0 and 0.3** — technically positive, practically noise.
- **30% between 0.3 and 0.6** — the honest middle: some signal, lots of luck.
- **Only 25% cleared 0.6**, where you could say tuning was genuinely informative.
In other words: pick a grid at random, tune it, and you have roughly a one-in-four chance your optimization was worthless and only a one-in-four chance it was solid. You cannot tell which quarter you're in from the in-sample numbers alone — that's the entire trap.
But 0.37 isn't zero
Here's where the data pushes back on pure cynicism, and it's worth saying plainly. A median of 0.37 is weak, but it is *positive*. Tuning small, structural grids does carry some signal — in the parent study we found the tuned pick beat the template's factory-default settings out-of-sample in 69% of cells. So the lesson is not "never optimize."
The lesson is subtler and more useful: in-sample parameter differences are mostly noise with a little signal mixed in, and the noise fraction grows with every combination you test. Each extra setting you try is another lottery ticket in the in-sample draw — more chances for a mediocre configuration to get lucky and top the ranking for reasons that won't repeat. A 0.37 median across small grids is the *optimistic* case; on a thousand-combination sweep it would be worse.
What to do instead
You can't make parameter rankings more predictive, but you can stop trusting them blindly:
- **Hold out data and touch it once.** The out-of-sample window is the only honest referee. Walk-forward testing formalizes this — read [what walk-forward analysis actually does](/docs/walk-forward) — by re-tuning and re-testing across rolling windows so no single split flatters you.
- **Count your attempts.** Every configuration you try raises the bar your result must clear. The [deflated Sharpe ratio](/glossary/sharpe-ratio) corrects a backtest's Sharpe for the number of trials behind it — it's why a "1.5 Sharpe from 500 combos" can be worth less than a "1.0 from 5."
- **Prefer plateaus to peaks.** When you sweep, look at whether good results cluster or stand alone. A lone spike is the shape of overfitting.
- **Let a robustness score do the accounting for you.** Our [free backtester](/whatif) runs the held-out test, the trial correction and the plateau check automatically and gives you a single [robustness verdict](/prove-it) — so you find out whether your edge is real before your broker does.
None of this is a counsel of despair. Tuning has a place; it just has a much smaller, more supervised place than the "sort by Sharpe, ship the top row" workflow assumes. Rank your parameters if you like — then treat the ranking as a hypothesis to be tested on unseen data, never as a conclusion. Download the full dataset and check the 0.37 yourself.
Past performance does not guarantee future results. This is educational content, not financial advice.
Probier es mit deinen eigenen Daten
Jedes Konzept oben ist in der Plattform umgesetzt. Backtesten, Walk-Forward, Paper-Trade, dann live schalten — gleiches Regelwerk in jeder Phase.