In questa pagina
The Donchian Channel is the breakout indicator behind the famous Turtle trading experiment: buy when price makes a new N-bar high, exit when it makes a new M-bar low. It is one of the simplest rules in trading to state — which is exactly why it is one of the easiest to overfit. This walkthrough takes a Donchian breakout from rules to a result you can trust, and flags the two places traders fool themselves.
Step 1: turn the breakout into complete rules
A Donchian Channel plots the highest high and lowest low over a lookback — the upper and lower channel. A breakout strategy says: go long when price closes above the upper channel (a new N-bar high), and exit when it closes below a shorter lower channel. That is already more complete than most breakout "ideas", but it still needs a stop and, crucially, a way to survive chop.
Breakouts have a brutal failure mode: in a ranging market, price pokes above the channel, triggers the entry, then immediately reverses — a false breakout — over and over. The classic defences are a longer channel (fewer, higher-quality signals) and a trend filter (only take breakouts when a long moving average is rising). Without one of those, a Donchian system gets chopped to death sideways.
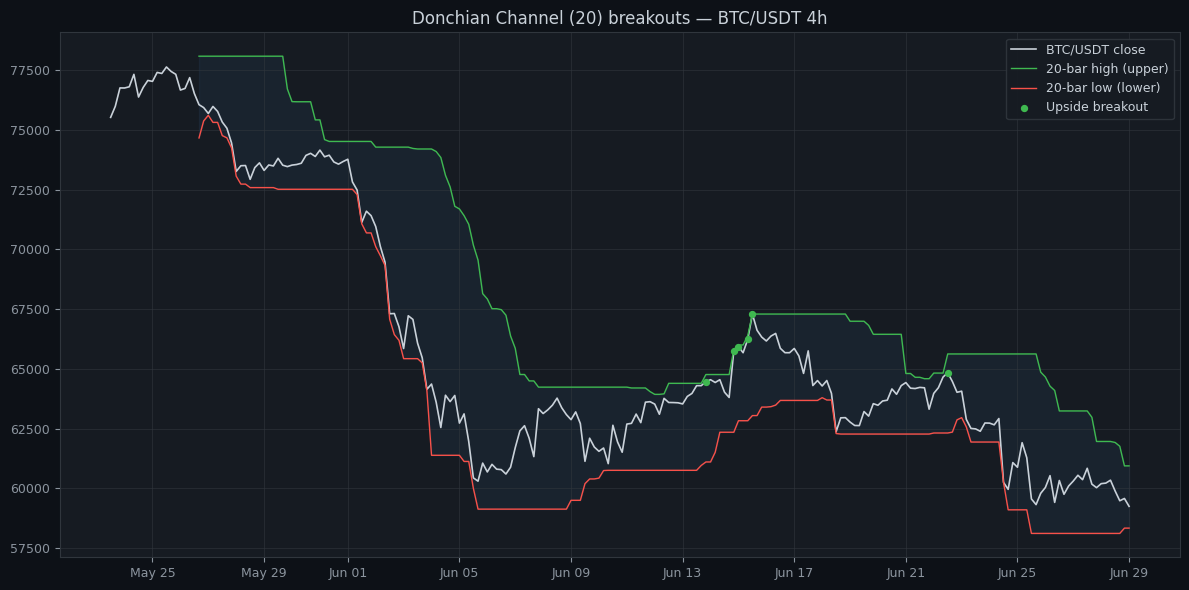
The chart marks every upside breakout — a close above the prior 20-bar high. Notice how some occur at the start of a clean move and pay off, while others fire in the middle of a range and reverse within a few candles. The whole art of a breakout system is keeping the first kind and filtering out the second.
Step 2: get clean, multi-regime data
Breakout strategies live and die by regime, so test on data that contains both. A Donchian system will look spectacular on a 2021-style trending year and dismal through a long range — and the truth is the blend. Pull real OHLCV for your exact symbol, timeframe, and exchange across a trend, a chop phase, and a crash.
Step 3: run it and read the right metrics
Donchian breakout systems characteristically have a low win rate and high reward-to-risk — many small false-breakout losses paid for by a few large trend-capturing wins. That means win rate is a terrible way to judge one. Read profit factor, maximum drawdown, and average win versus average loss instead, and brace for long losing streaks between the trends that pay.
strategy:
  name: donchian_breakout
  indicators:
    - { id: dc, kind: DONCHIAN, period: 20 }
    - { id: ema_trend, kind: EMA, period: 100 }
  rules:
    entry:
      all:
        - { type: crosses_above, left: close, right: dc.upper }
        - { type: above, left: close, right: ema_trend }   # trend filter
    exit:
      any:
        - { type: crosses_below, left: close, right: dc.lower }
  risk:
    size_pct: 0.5
    stop_loss_atr: 2.5
Step 4: walk-forward the lookback
The channel length is the parameter everyone overfits. Search every lookback from 10 to 55 on your full history and one of them will have caught the big trends perfectly — and it will mean nothing. Walk-forward is the cure: tune the lookback on an in-sample window, test it on the next window the optimiser never saw, and roll forward. A Donchian system that only works at length 27 because 27 happened to fit the past is overfit; one whose edge survives a range of lookbacks out-of-sample is a real breakout edge.
Do it in Noon Barbari
The Donchian Channel is a built-in indicator, and a channel-breakout template ships as a reference strategy. Build the entry, exit, trend filter, and stop in the visual designer, backtest it across years of crypto in seconds, then walk-forward the lookback to see whether your breakout is a real edge or a fitted memory. The breakout that built the Turtles still works — but only if you test it honestly.
Provalo con i tuoi dati
Ogni concetto visto sopra è implementato nella piattaforma. Backtest, walk-forward, paper trading, poi passa al live — stesso set di regole in ogni fase.