
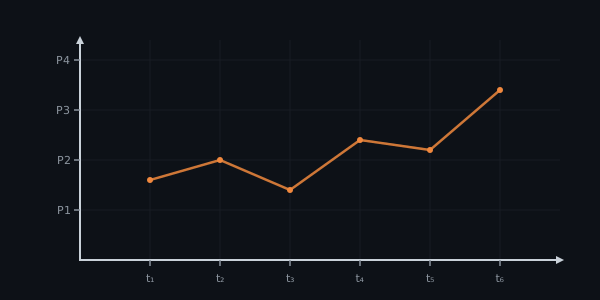
A Price chart looks intimidating because there is a lot of ink on the screen, but underneath the indicators and overlays it is the same three components on every platform: a horizontal time axis, a vertical price axis, and a series of marks summarising what happened between adjacent moments in time. Master that mental model and every chart you ever open is suddenly the same chart, just dressed differently.
The axes
Time runs left to right; the most recent bar is at the right edge. Price runs bottom to top; higher numbers are higher up. Both axes can be linear or logarithmic. Linear is what beginners expect — equal distances mean equal absolute moves. Log scale makes equal distances mean equal percentage moves, which matters once you are looking at assets that span an order of magnitude or more. For day-trading time horizons it rarely matters; for long-history crypto charts it matters a lot.
Timeframes
Each bar on the chart covers some fixed window of time, called the Timeframe. On a 1-hour chart, one bar is one hour of trading. On a 1-day chart, one bar is a calendar day. The same instrument can look like a clean uptrend on the daily and a chaotic mess on the 5-minute. Neither is wrong — they are showing different questions. Always read the timeframe label before forming an opinion.
What each bar tells you
Every bar — regardless of the visualisation style — encodes OHLC: the open (first traded price in the window), the high (the maximum), the low (the minimum), and the Close (the last traded price). Those four numbers are the entire factual content of the bar; everything else is presentation.
Réflexion
Open a chart of any asset on three timeframes — 15-minute, 4-hour, daily. What story does each one tell you, and which would you trust if they disagreed?
Pour aller plus loin
Des analyses approfondies sur ce sujet, sur notre blog (en anglais).
- Candlestick anatomy: what OHLC, body and wick actually tell youCandlestick anatomy explained: open, high, low, close, body and wick — what each piece tells you, the information lost between timeframes, and how to read one.
- Support and resistance: turning a vague idea into a testable ruleSupport and resistance explained: what the levels really are, why hand-drawn lines don't backtest, and how to define them as objective, testable rules.