Sur cette page
Here is the most seductive workflow in all of strategy development: take a rule, sweep its parameters across hundreds of combinations, sort by Sharpe, and ship the winner. It feels rigorous — you tested *everything*. It is, in fact, the single most reliable way to manufacture an edge that does not exist. Understanding why is the difference between a strategy and an expensive illusion.
Why searching guarantees a winner
If you test 500 parameter combinations on one slice of history, some of them will look spectacular *by chance alone*. Markets are noisy; over any fixed window, random luck will hand a few parameter sets a gorgeous equity curve that has nothing to do with a repeatable edge. The more combinations you try, the higher the best one scores — not because the strategy got better, but because you gave randomness more lottery tickets. This is overfitting by another name: you have fitted your parameters to the noise in one specific past.
The arithmetic is unforgiving. Test a thousand parameter combinations and, even on a strategy with zero true edge, you should *expect* several to post a backtest Sharpe above 2 from luck alone. The optimiser can't tell skill from noise — it just hands you the top of the list, and the top of a long enough list is almost always noise wearing a crown.
The tell is in the *shape* of the result, not the height of the peak.
The plateau and the spike
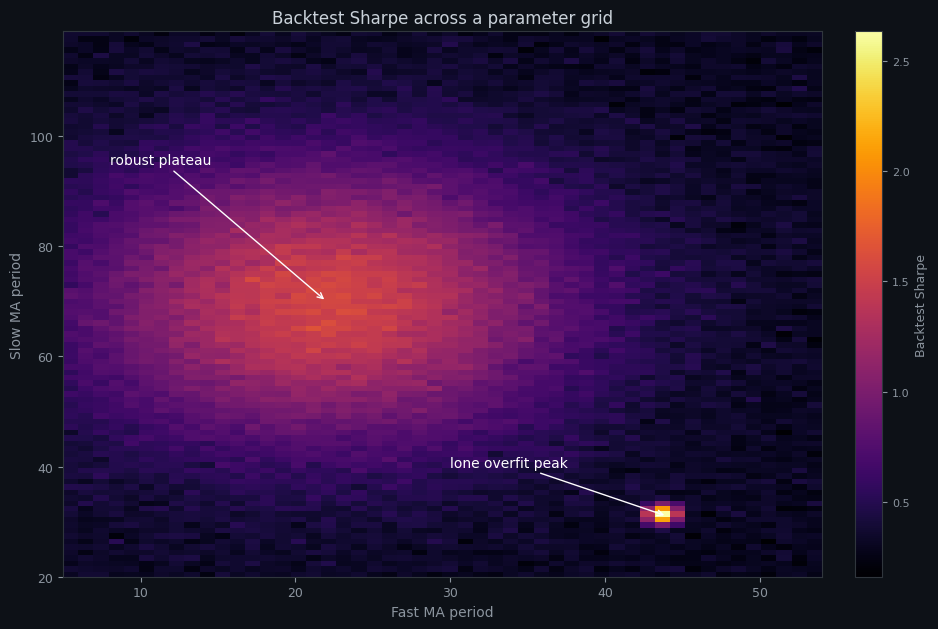
The heatmap above is a backtest's Sharpe across two parameters. There are two very different features on it, and they mean opposite things:
- **The robust plateau** — the broad, warm region where many neighbouring parameter values all perform reasonably well. This is what a real edge looks like: the strategy is not sensitive to the exact numbers, so small changes barely matter. A live market that drifts slightly from your test conditions lands you somewhere else on the plateau, still fine.
- **The lone overfit peak** — the single bright cell standing alone in a sea of dark, dramatically better than every neighbour. This is the one a naive optimiser picks, and it is almost always a fluke. Nudge either parameter by one step and the edge vanishes. Live, the market *will* nudge you off that pixel, and the "edge" evaporates.
The fix: judge regions, validate out-of-sample
Two disciplines defuse the trap. First, prefer plateaus to peaks: pick parameters from the middle of a broad robust region, even if a lone spike scored higher, because the plateau is far more likely to survive into the future. Second, and decisively, validate on data the optimiser never saw. Walk-forward optimization tunes parameters on an in-sample window and then scores them on the *next* window — so a fluke that only worked on the fitting period is exposed immediately, while a genuine plateau holds up. The deflated Sharpe ratio goes further, mathematically discounting your best result by how many combinations you tried.
There's also a simple hygiene rule: the fewer parameters, the less room to overfit. Every extra knob multiplies the combinations you can search and the noise you can fit. A two-parameter strategy that holds up out-of-sample is worth far more than a six-parameter one that needed every degree of freedom to look good.
See it for yourself
Noon Barbari's optimiser is built around this exact discipline — it surfaces the parameter surface and a robustness score, not just the single best number, and you can walk-forward any tuning to see whether your "best" parameters are a plateau or a peak. The goal of optimisation is never the highest backtest. It is the most *robust* one — the result you can still trust after the market moves on. For the broader picture of why optimised backtests disappoint live, see why your live trading underperforms your backtest.
Essaie-le sur tes propres données
Chaque concept ci-dessus est implémenté dans la plateforme. Backtest, walk-forward, paper trading, puis passage en live — même jeu de règles à chaque étape.