On this page
Momentum is the oldest documented edge in markets: assets that have gone up recently tend to keep going up a little longer than chance would predict. In crypto, where trends run hard and narratives compound, momentum is especially pronounced — and especially dangerous, because the same strategy that rides a trend will happily buy the blow-off top. This walkthrough builds a momentum strategy and backtests it without falling into that trap.
Step 1: turn "buy strength" into a measurable rule
"Buy what's going up" needs a definition of *going up*. The cleanest is the rate of change (ROC): the percentage return over a lookback, say the last 20 days. Positive and rising ROC means strengthening momentum; negative and falling means it's fading. That single number turns a vague instinct into something you can test.
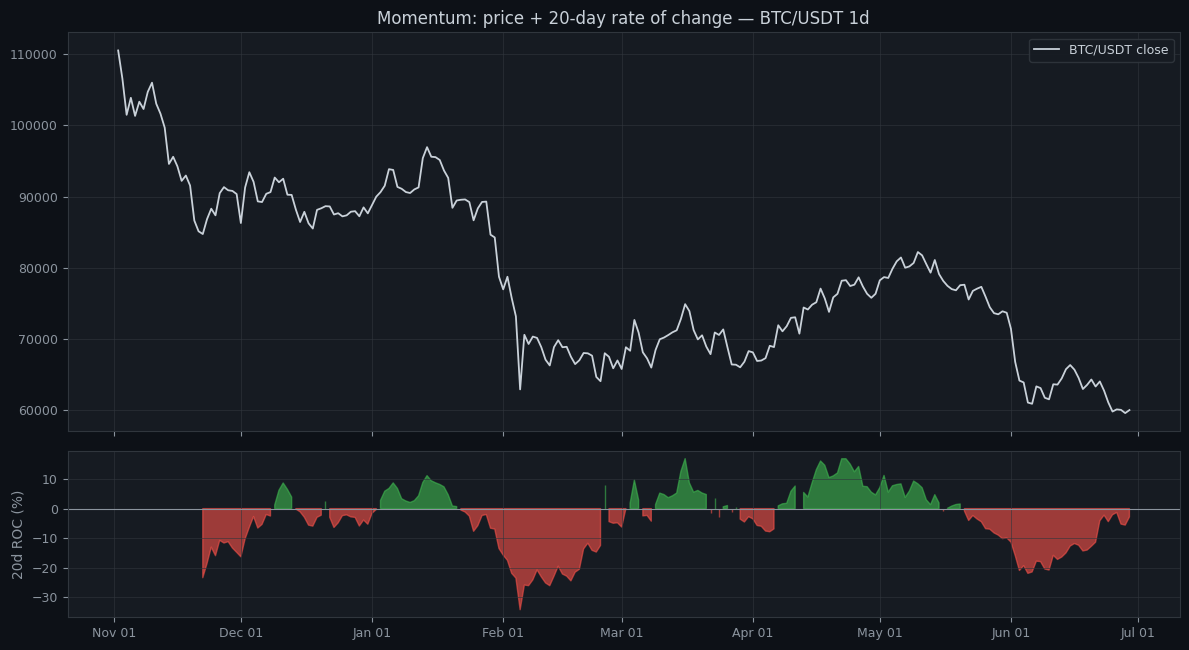
The chart shows price with its 20-day ROC beneath. Two things stand out. Momentum can stay positive for a long time, which is *why* trend-following works — strength persists. But it also flips *after* the top, not before, which is the momentum trader's central problem: by the time momentum confirms, some of the move is already gone, and the last buyers are the ones who buy the high.
Step 2: complete the rules — entry, exit, and a brake
A tradeable momentum strategy needs more than an entry. Define: an entry when momentum turns and holds positive; an exit when it fades back through zero or a trailing stop is hit; and a risk brake, because momentum's failure mode is the violent reversal. Many momentum systems also add a long-term trend filter — only take longs while price is above a 200-period average — to avoid catching falling knives that have a brief positive bounce in ROC. The exit deserves as much care as the entry: momentum gives back gains fast when it turns, so a trailing stop or a prompt exit on the momentum flip usually beats a fixed target that lets a winner round-trip back to your entry.
Step 3: get multi-regime data and read the right metrics
Momentum's character flips entirely between regimes, so test across both a trending stretch and a long range. In trends it prints; in chop it gets whipsawed buying every false start. Judge it on profit factor, maximum drawdown, and the average win versus average loss — momentum typically wins less than half its trades but wins big when it's right.
strategy:
  name: momentum_roc
  indicators:
    - { id: roc, kind: ROC, period: 20 }
    - { id: ema_trend, kind: EMA, period: 200 }
    - { id: atr, kind: ATR, period: 14 }
  rules:
    entry:
      all:
        - { type: crosses_above, left: roc, right: 0 }
        - { type: above, left: close, right: ema_trend }   # only in uptrends
    exit:
      any:
        - { type: crosses_below, left: roc, right: 0 }
  risk:
    stop_loss_atr: 2.5
    size_pct: 0.5
Step 4: walk-forward, because momentum overfits easily
The lookback period is the parameter that begs to be overfit — sweep it from 10 to 50 days and one value will have caught your sample's big trends perfectly. That's a memory, not an edge. Walk-forward tunes the lookback in-sample and tests it on the next, unseen window, so a value that only worked by hindsight is exposed. A momentum edge that survives out-of-sample is one of the more durable ones in trading — see trend following vs mean reversion for how it pairs with its opposite.
Do it in Noon Barbari
Build the ROC entry, the trend filter, and the ATR stop in the visual strategy designer, backtest it across years of crypto in seconds, and walk-forward the lookback to see whether your momentum window is a real parameter or just the one that fit the past. Momentum is a genuine edge — but only the version that survives the chop, not the one that memorised the last bull run.
Try it on your own data
Every concept above is implemented in the platform. Backtest, walk-forward, paper-trade, then promote to live — same rule set, all stages.