
In questa pagina
Ogni forum di trading ha lo stesso post ricorrente: una equity curve bellissima, un set di parametri ottimizzato e la didascalia "questo funziona". Volevamo un numero che dicesse quanto di tutto ciò è reale. Così l'abbiamo misurato — su larga scala, con un protocollo che non ci permette di barare e con il codice dello sweep committato nel nostro repository, così che chiunque possa rieseguirlo.
La versione breve: abbiamo ottimizzato 200 combinazioni strategia-coin sulla loro stessa storia ed eseguito ogni vincitore ottimizzato una sola volta su dati che non aveva mai visto. Lo Sharpe ratio del vincitore attraente mediano è sceso da 1,22 a 0,64 — circa metà dell'"edge" era memoria, non segnale. Il 54% ha perso più della metà del proprio Sharpe e, su tutte le 200 scelte ottimizzate, il 44% è finito a zero o in negativo. Quello che segue è il metodo, i grafici, i numeri che ci hanno sorpreso in entrambe le direzioni e ciò che davvero sopravvive.
L'esperimento
Abbiamo preso le dieci famiglie di strategie dalla nostra libreria pubblica di template — gli stessi rule set YAML che chiunque può eseguire sul sito: mean-reversion su RSI, incrocio di EMA, trend MACD, SuperTrend, breakout su SMA, reversion sulle bande di Bollinger, breakout su ATR, Trend Magic e due template smart-money-concepts (order block e fair value gap).
Per ogni famiglia abbiamo definito una griglia di parametri piccola e realistica — le stesse manopole che gli utenti della strategia regolano davvero: periodi di lookback, soglie di entrata/uscita, ampiezze delle bande, distanze degli stop. Nessun parametro esotico e nessuna griglia da mille combinazioni: tra 9 e 64 combinazioni per famiglia, esattamente il tipo di esplorazione "fammi provare qualche impostazione" che ogni trader fa.
Poi, per ognuna delle 20 coppie USDT liquide (BTC, ETH e il resto dell'universo large-cap), su barre giornaliere da gennaio 2021 a luglio 2026:
- **Dividere la storia cronologicamente: primo 70% in-sample, ultimo 30% out-of-sample.** La finestra out-of-sample copre all'incirca gli ultimi 20 mesi — condizioni di mercato che la finestra in-sample non contiene.
- **Eseguire ogni combinazione di parametri sulla finestra in-sample** e scegliere quella con il miglior Sharpe ratio. Questa è la configurazione che un curve-fitter metterebbe in produzione — e, onestamente, la configurazione che mostra la maggior parte degli screenshot di backtest.
- **Eseguire quel vincitore una sola volta sulla finestra out-of-sample.** Nessuna ri-ottimizzazione, nessun secondo sguardo, nessuna sopravvivenza selettiva: ogni risultato è nei dati qui sotto, compresi quelli imbarazzanti.
Sono 5.720 configurazioni, ciascuna eseguita su entrambe le finestre — 11.440 esecuzioni del motore in totale, tutte attraverso lo stesso backtester event-driven che alimenta il nostro backtester gratuito, con il suo modello predefinito di commissioni e slippage. Lo script dello sweep, le griglie e il codice di analisi vivono nel nostro repo; lo studio è riproducibile da cima a fondo.
Scoperta 1: la maggior parte delle combinazioni non è mai sembrata buona nemmeno all'inizio
Prima di qualsiasi test out-of-sample, una base di partenza che fa riflettere: anche con la libertà di scegliere la migliore tra decine di impostazioni, solo 37 su 200 combinazioni strategia-coin (18%) hanno prodotto un risultato in-sample "attraente" — uno Sharpe di almeno 1,0 con almeno 10 trade. Tre famiglie (mean-reversion su RSI, trend MACD e reversion su Bollinger) non hanno superato quella soglia su *nemmeno una* coin su venti, neppure dopo l'ottimizzazione.
Ricordatelo la prossima volta che uno screenshot ti mostra quella che ha funzionato: stai guardando il sopravvissuto di una pila enorme e invisibile.
Scoperta 2: il taglio out-of-sample
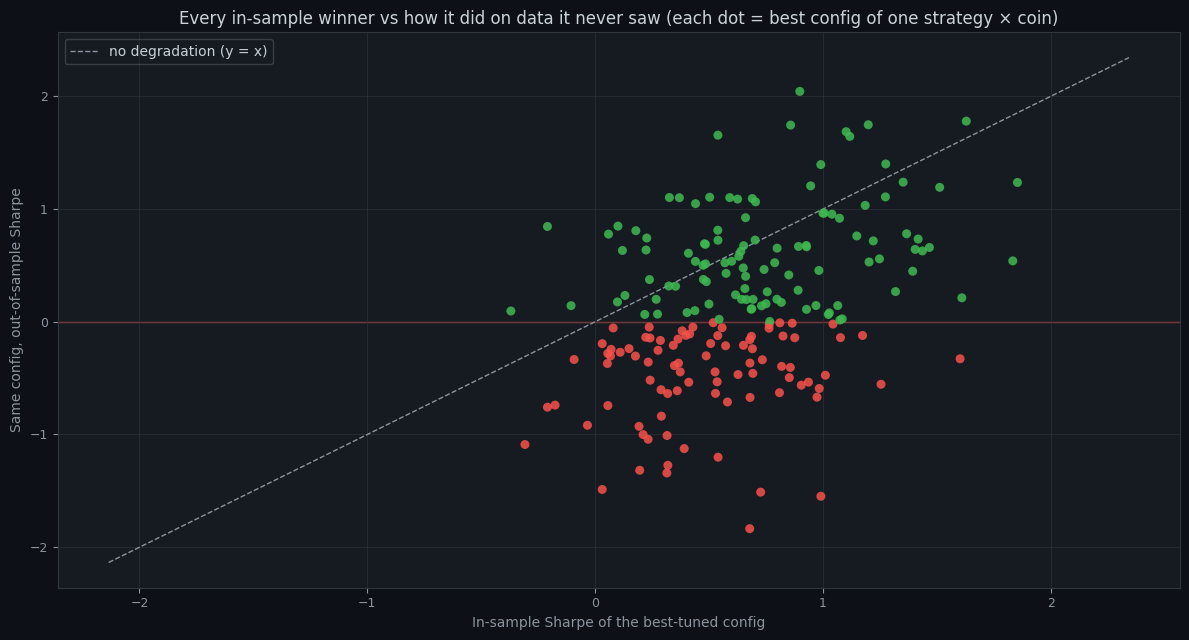
Se l'ottimizzazione trovasse puro segnale, i punti aderirebbero alla diagonale. Non lo fanno — la nuvola si trova sistematicamente al di sotto. Per i 37 vincitori attraenti:
- **Lo Sharpe mediano è sceso da 1,22 in-sample a 0,64 out-of-sample.** Circa metà dell'edge apparente è evaporata al contatto con dati mai visti.
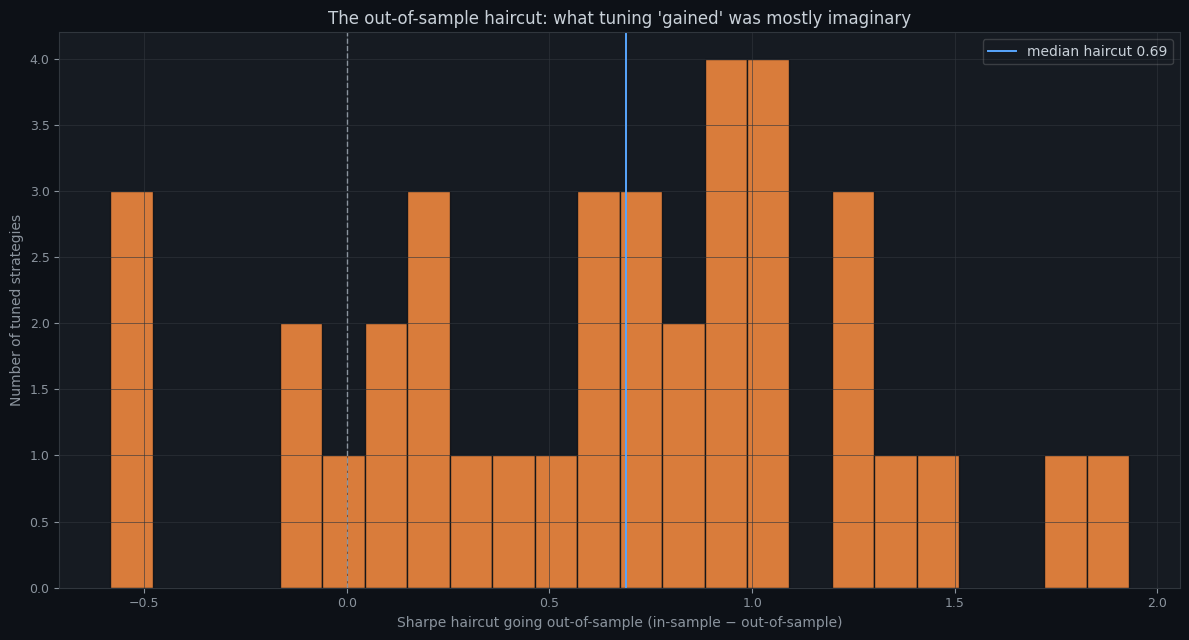
- **Il 54% ha perso più della metà del proprio Sharpe.** Il **taglio mediano è stato di 0,69** punti di Sharpe.
- **Il 16% è crollato del tutto** a uno Sharpe pari a zero o inferiore.
- Su **tutte le 200** scelte ottimizzate (non solo quelle attraenti), **il 44% è finito a zero o in negativo** out-of-sample.
Scoperta 3: il ranking in-sample è una guida debole — ma non inutile
Qui è dove i dati hanno contraddetto la lettura cinica, e riportiamo anche questo. All'interno di ogni griglia strategia-coin abbiamo classificato ogni combinazione per Sharpe in-sample e di nuovo per Sharpe out-of-sample, poi abbiamo misurato la correlazione dei ranghi.
La correlazione dei ranghi mediana è stata 0,37 — positiva, ma debole. Ed era estremamente instabile: in un quarto delle griglie la correlazione era zero o negativa (scegliere il vincitore in-sample non era meglio che scegliere a caso), mentre nel quartile migliore superava 0,60.
Ottimizzare griglie piccole e strutturali portava con sé *un po'* di segnale: la scelta ottimizzata ha battuto le impostazioni di fabbrica del template out-of-sample nel 69% delle celle. Quindi la conclusione onesta non è "mai ottimizzare" — è che le differenze in-sample sono per lo più rumore con un po' di segnale mescolato dentro, e non puoi sapere in quale griglia ti trovi senza tenere da parte dei dati. Più grande è la griglia, più il rumore vince: ogni combinazione in più che provi alza l'asticella che il tuo risultato deve superare — che è esattamente ciò che uno Sharpe ratio deflazionato corregge, ed è il motivo per cui la nostra scorecard di robustezza lo usa.
Quali famiglie hanno retto
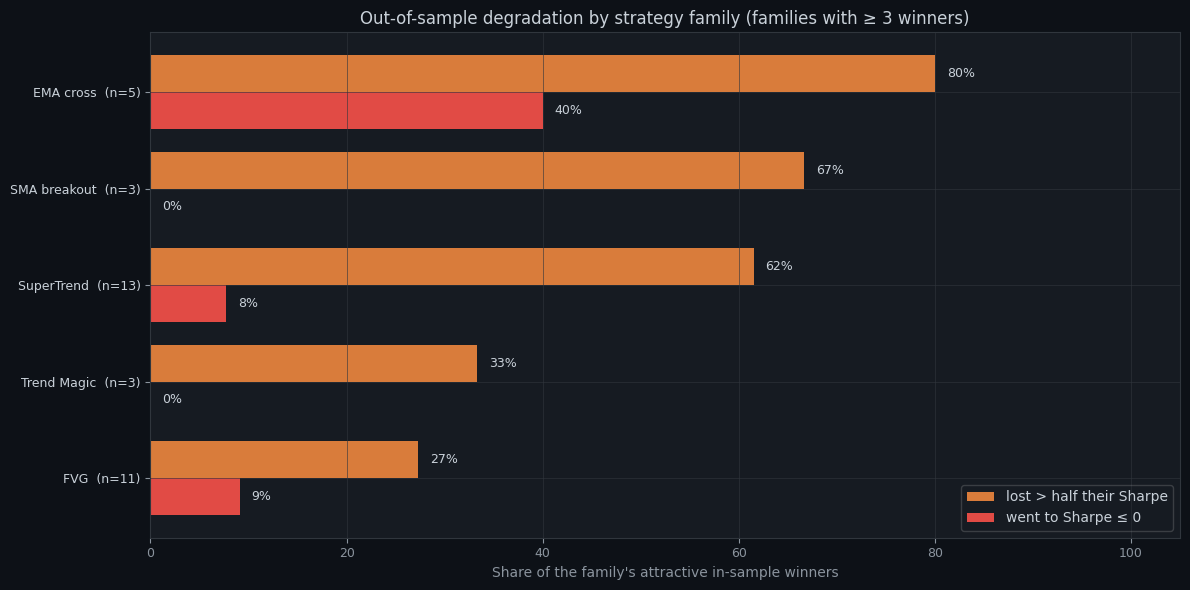
La dispersione è istruttiva. SuperTrend è stato il vincitore in-sample più prolifico (13 coin su 20) — e 8 di quei 13 hanno perso più della metà del loro Sharpe out-of-sample. Il template fair-value-gap ha prodotto 11 vincitori attraenti e ha retto relativamente bene. E le tre famiglie che non hanno mai prodotto un vincitore attraente da nessuna parte non sono necessariamente strategie *cattive* — su barre giornaliere in questo periodo, semplicemente non hanno mai avuto l'edge che la loro reputazione promette, comunque si girassero le manopole. Anche questo vale la pena saperlo prima che lo scopra il denaro reale.
Cosa questo studio non dice
Uno studio onesto elenca i propri limiti: questa è una sola asset class (crypto), un solo timeframe (barre giornaliere), un solo punto di split (70/30), una sola griglia per famiglia e il modello di commissioni predefinito del motore. Lo Sharpe su una finestra di ~20 mesi è esso stesso una stima rumorosa — alcuni "collassi" sono sfortuna piuttosto che curve-fit, e alcuni sopravvissuti sono fortunati. Una famiglia long-only che incontra un regime out-of-sample ostile prende una batosta ingiusta. Nulla di tutto ciò salva il titolo: su dieci design di strategia non correlati, l'ottimizzazione in-sample ha sistematicamente promesso circa il doppio di quanto ha consegnato.
E una cosa che questo studio esplicitamente non è: la prova che il backtesting sia inutile. È la prova che il backtesting *non validato* fabbrica fiducia. La soluzione non è smettere di testare — è testare come ha fatto questo studio: tieni da parte dei dati, toccali una sola volta, conta i tuoi tentativi e lascia che il risultato sopravviva su dati che non ha mai visto.
I dati sono pubblici
Non fidarti sulla parola. Il dataset completo — tutti gli 11.440 run del motore, una riga ciascuno, con l'esatta combinazione di parametri e Sharpe, rendimento, drawdown e numero di trade di entrambe le finestre — è pubblicato con licenza CC BY 4.0 sulla nostra pagina open data, in CSV e JSONL, con tabella dello schema e citazione suggerita. Ripeti l'analisi, tagliala diversamente o prova a smontare la conclusione.
Fai passare la tua strategia attraverso lo stesso percorso a ostacoli
Tutto ciò che questo studio ha fatto a mano — i dati tenuti da parte, il punteggio di robustezza, il verdetto onesto — è ciò che il nostro backtester gratuito esegue su qualsiasi strategia in circa un minuto. Nessuna registrazione, nessuna carta. Se la tua idea è reale, sopravviverà. Se non lo è, l'hai appena scoperto gratis.
Le performance passate non garantiscono risultati futuri. Questo studio è contenuto educativo, non un consiglio finanziario.
Provalo con i tuoi dati
Ogni concetto visto sopra è implementato nella piattaforma. Backtest, walk-forward, paper trading, poi passa al live — stesso set di regole in ogni fase.