Auf dieser Seite
"My strategy has a Sharpe of 1.8." It sounds precise and authoritative, and it's the number everyone reaches for to compare strategies. But the Sharpe ratio answers one specific question, and traders constantly ask it to answer questions it can't. Used well it's the single most useful summary of a strategy. Used carelessly it's a confidence trick you play on yourself.
What the Sharpe ratio actually measures
The Sharpe ratio is return per unit of risk: take your returns above the risk-free rate, divide by their standard deviation (their volatility), and annualise. The whole point is that return alone is meaningless without the risk you took to get it. A strategy that made 30% by white-knuckling through 50% swings is worse than one that made 20% on a smooth ride — and Sharpe is the number that says so.
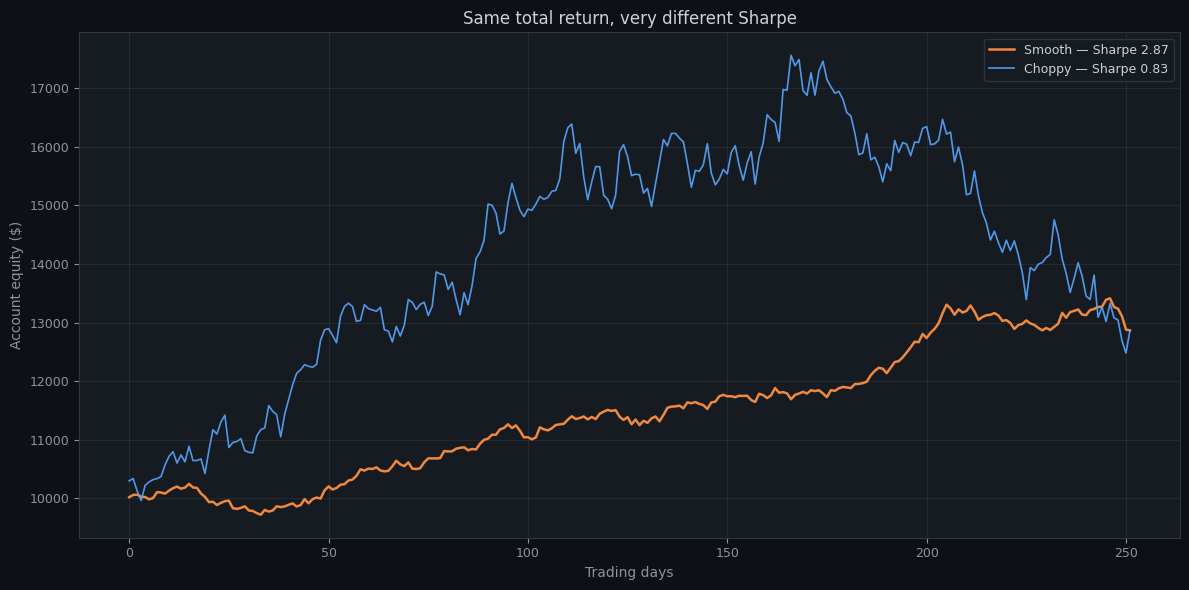
The chart makes the idea concrete. Both curves start and end at exactly the same equity — the *total return is identical*. Yet the smooth path has a Sharpe near 2.9 and the wild one near 0.8, because Sharpe punishes the volatility you endured along the way. If you only looked at final return, the two would seem equal. They are not: the smooth one is far more likely to be a real, repeatable edge, and far easier to actually hold through.
What counts as a "good" Sharpe
There's no universal threshold, but a rough field guide for a backtested crypto strategy, *net of realistic costs*:
- **Below 0.5** — barely distinguishable from noise. Be sceptical.
- **0.5 to 1.0** — a plausible edge, but fragile; demands tight validation.
- **1.0 to 2.0** — a solid, tradeable result if it holds out-of-sample.
- **Above 2.0** — excellent, and a reason to get *suspicious*, not excited — see below.
That suspicion is the important part. In backtesting, an unusually high Sharpe is more often a symptom of a problem than a sign of brilliance.
When the Sharpe ratio lies
A high in-sample Sharpe sets off alarms because the most common causes are mistakes, not edges:
- **It's overfit.** Grid-search enough parameters on one slice of history and you'll find a combination with a gorgeous Sharpe — a [curve fit](/blog/what-is-overfitting-in-trading), not a strategy. The [deflated Sharpe ratio](/blog/deflated-sharpe-ratio) exists precisely to discount the Sharpe you "found" by how many combinations you tried.
- **The sample is too short.** A 3.0 Sharpe over six weeks is statistically almost meaningless. Sharpe needs a long, multi-regime sample before the number stabilises.
- **It assumes returns are normal — crypto's aren't.** Standard deviation treats a calm market and a fat-tailed one the same way, so Sharpe systematically *understates* the risk of strategies that quietly sell volatility and then blow up. A strategy can post a beautiful Sharpe for months by picking up pennies, right until the tail event that the metric never priced in.
- **It penalises upside volatility.** Sharpe punishes big *up* days just as hard as big down days, which unfairly dings trend-following strategies whose whole edge is occasional huge winners.
- **It can be gamed.** Smoothing returns — through illiquid marks or by booking small steady gains while hiding tail risk — inflates Sharpe without making the strategy any safer.
Read it alongside its companions
Because Sharpe has these blind spots, never read it alone. Its Sortino and Calmar cousins cover what it misses: Sortino divides by *downside* volatility only, so it stops penalising the upside; Calmar divides return by maximum drawdown, capturing the tail pain Sharpe smooths over. A strategy with a great Sharpe but an ugly Calmar is telling you something important — that its risk lives in the tails, exactly where Sharpe is weakest.
How to actually use it
Read Sharpe as a *first-pass filter*, not a verdict. A respectable Sharpe earns a strategy the right to be validated further; it never confirms one on its own. The real test is whether that Sharpe survives walk-forward on data the optimiser never saw and holds up next to drawdown and downside risk. Every Noon Barbari backtest reports Sharpe next to drawdown, Sortino, and a robustness score — so you read return *and* risk together, the only way the number means anything. A Sharpe ratio is a great question to ask of a strategy. It is a terrible place to stop asking.
Probier es mit deinen eigenen Daten
Jedes Konzept oben ist in der Plattform umgesetzt. Backtesten, Walk-Forward, Paper-Trade, dann live schalten — gleiches Regelwerk in jeder Phase.